A market-microstructure research platform I designed, built and ran on my own: live feeds from fourteen exchanges, a terabyte-scale order-book recorder, replay simulators, learned predictors and a live pricing service.
I spent years building pricing, trading and risk systems for betting exchanges, where the edge lives in who sees a price move first and who is left quoting a stale one. Crypto has the same shape with far better data: dozens of venues list the same instrument, every order book is public in real time, and the fees and latencies are documented.
So I set out to answer a concrete question with measurement rather than intuition: when BTC moves on one exchange, how long do the others take to follow, and is that delay large enough to trade after fees, latency and real queue positions?
Answering it properly meant building the whole stack myself: connectors that survive days of streaming, a recorder that captures full depth, a replay engine that reproduces the books tick for tick, simulators with deliberately pessimistic fill models, and reports that make it hard to fool myself.
A single Spring Boot application runs in different profiles over one shared market model: record to capture data, train and test to replay it into predictors, view and live to watch markets with the models attached, and book to publish live prices over REST and WebSocket. Research runners and two Swing workbenches sit on the same code.
Every screenshot below was taken on 15 September 2026 from the running application or from reports it generated. None are mock-ups.
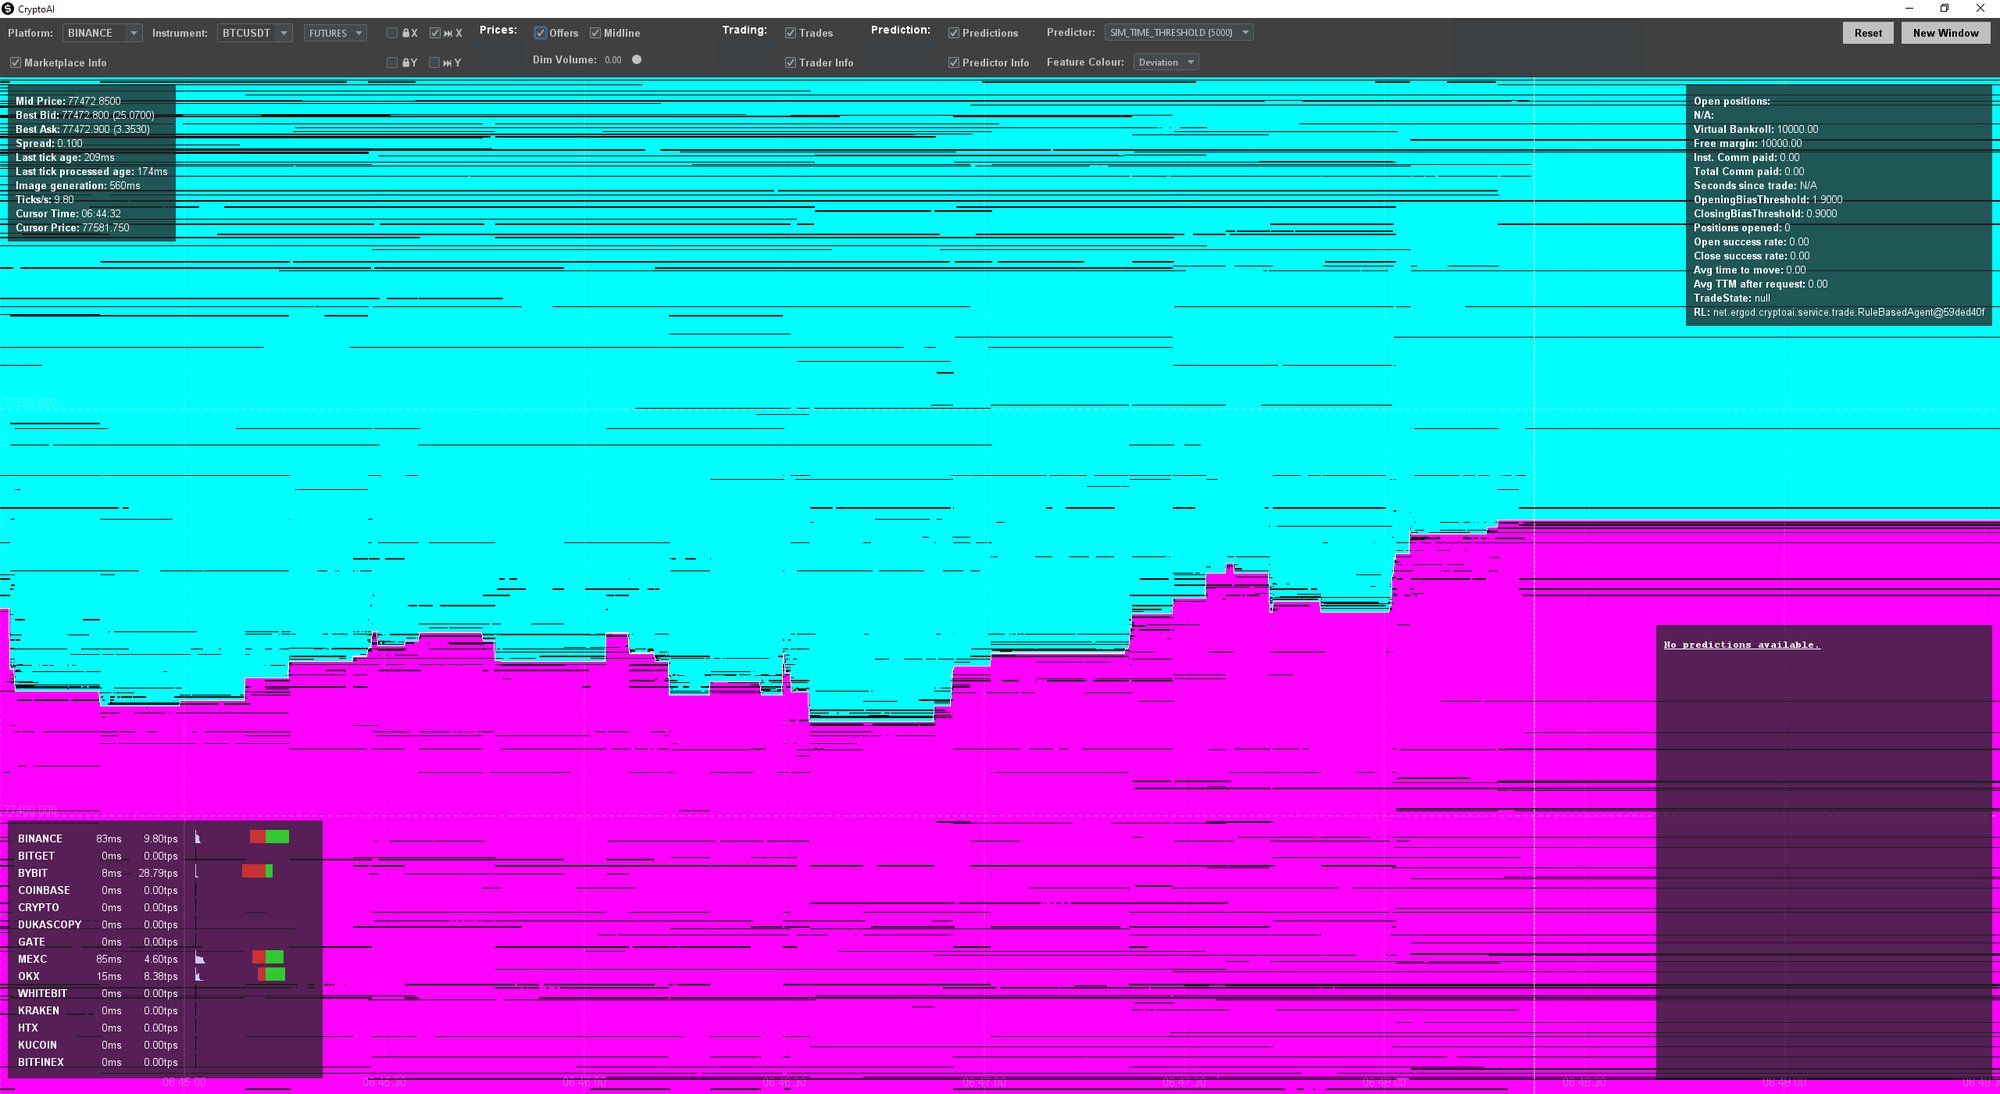
Live order-book depth for Binance BTCUSDT futures: cyan is resting ask liquidity, magenta resting bids, the white line the midpoint. Every level of every update is drawn as it arrives, so walls appearing and pulling are visible second by second.
The panel at the bottom left is the part I used most: each venue's tick rate and how stale its last update is, so a slow feed can't masquerade as a price leader. Top right is the simulated trader's state.
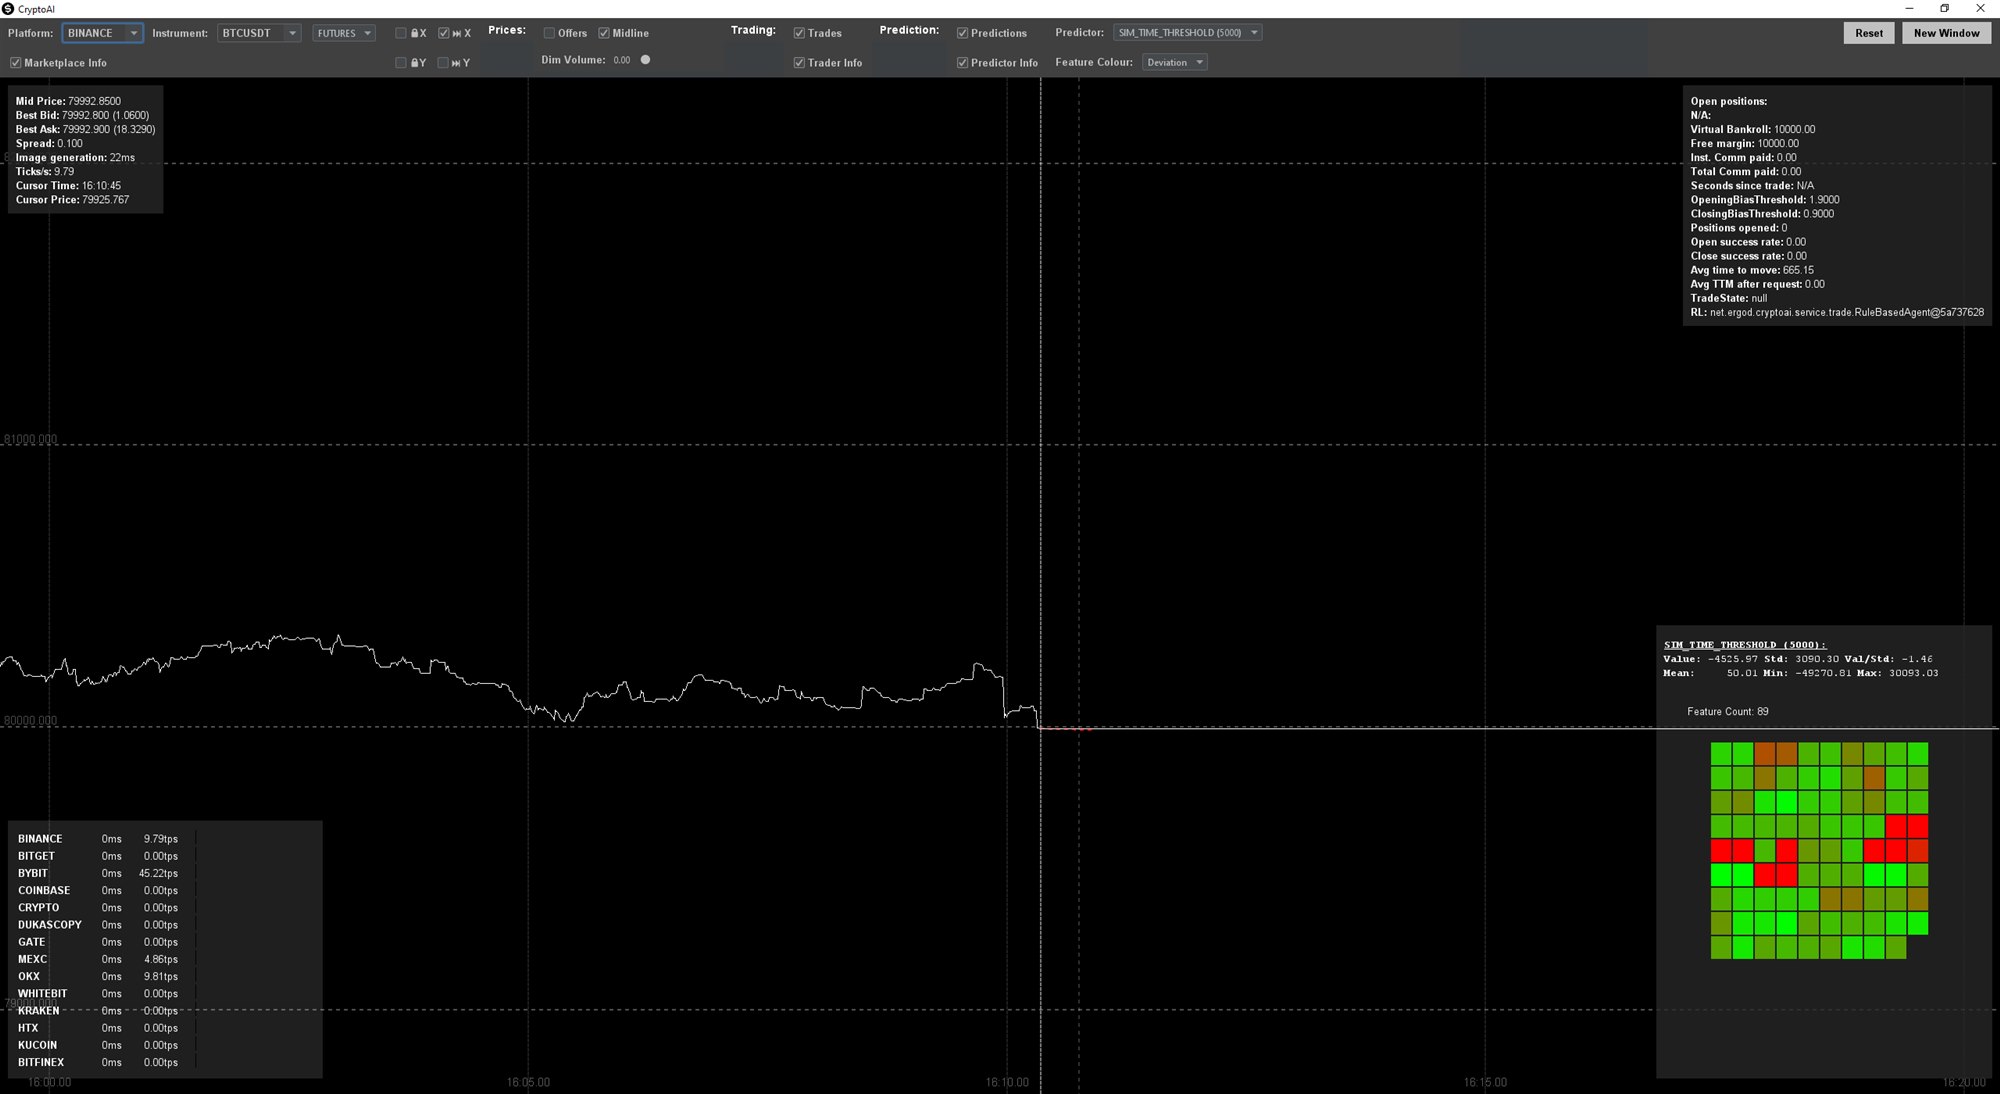
The same viewer replaying a recorded hour with a trained predictor attached. At the bottom right is the 5-second predictor's current output with its running mean, spread and range. Under it, a grid of its 89 input features is coloured by how far each sits from its training statistics. The features are exchange-rate EMAs, RSI, ARIMA forecasts, cross-venue route deltas and volume skew.
The honest numbers: this model reaches a correlation of 0.17 and a relative absolute error of 99.6%, measured in-sample on data that includes this test hour. That is barely better than predicting no move, which is why predictions ended up as a filter around stronger triggers rather than a signal of their own.
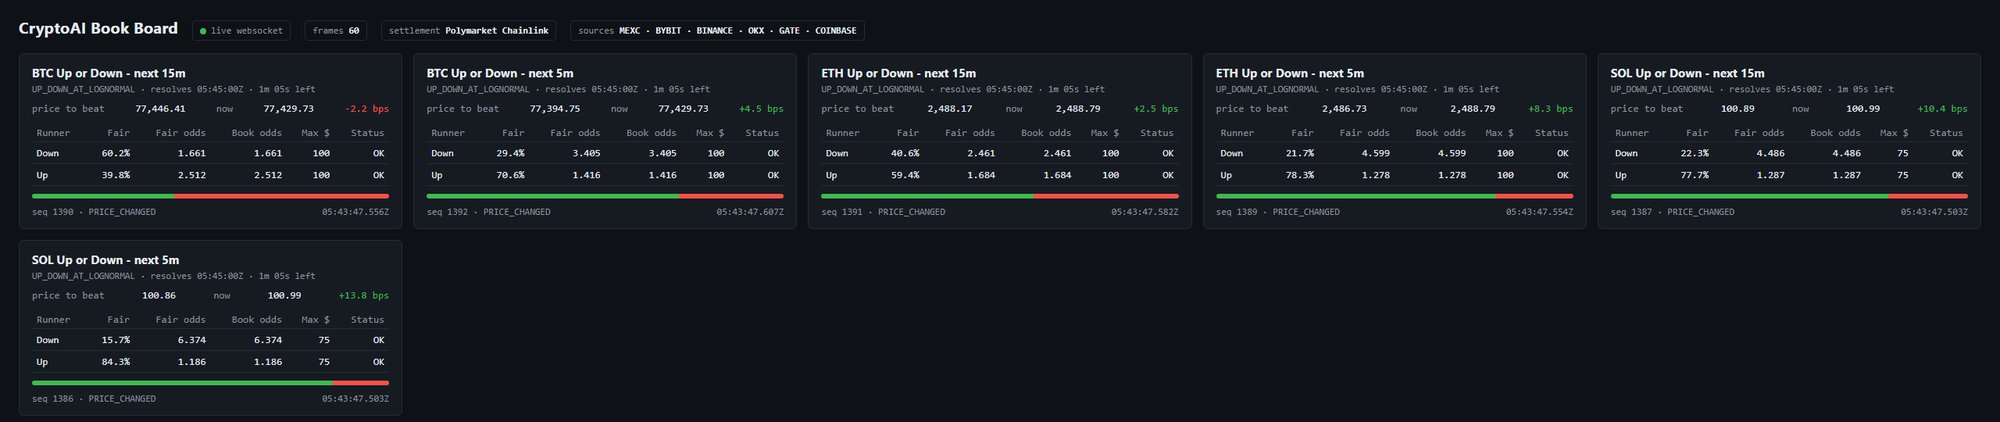
The newest part: a pricing service for rolling BTC, ETH and SOL "up or down" markets over 5 and 15 minute windows, aligned to Polymarket's boundaries and settled against the same Chainlink feed Polymarket uses. It locks each window's price to beat, then prices both sides with a lognormal model on the live Chainlink stream, with order books from five exchanges wired in as source feeds.
Prices stream over WebSocket only when they move by at least one basis point, with a heartbeat otherwise. This board is a small page I wrote on top of that stream.
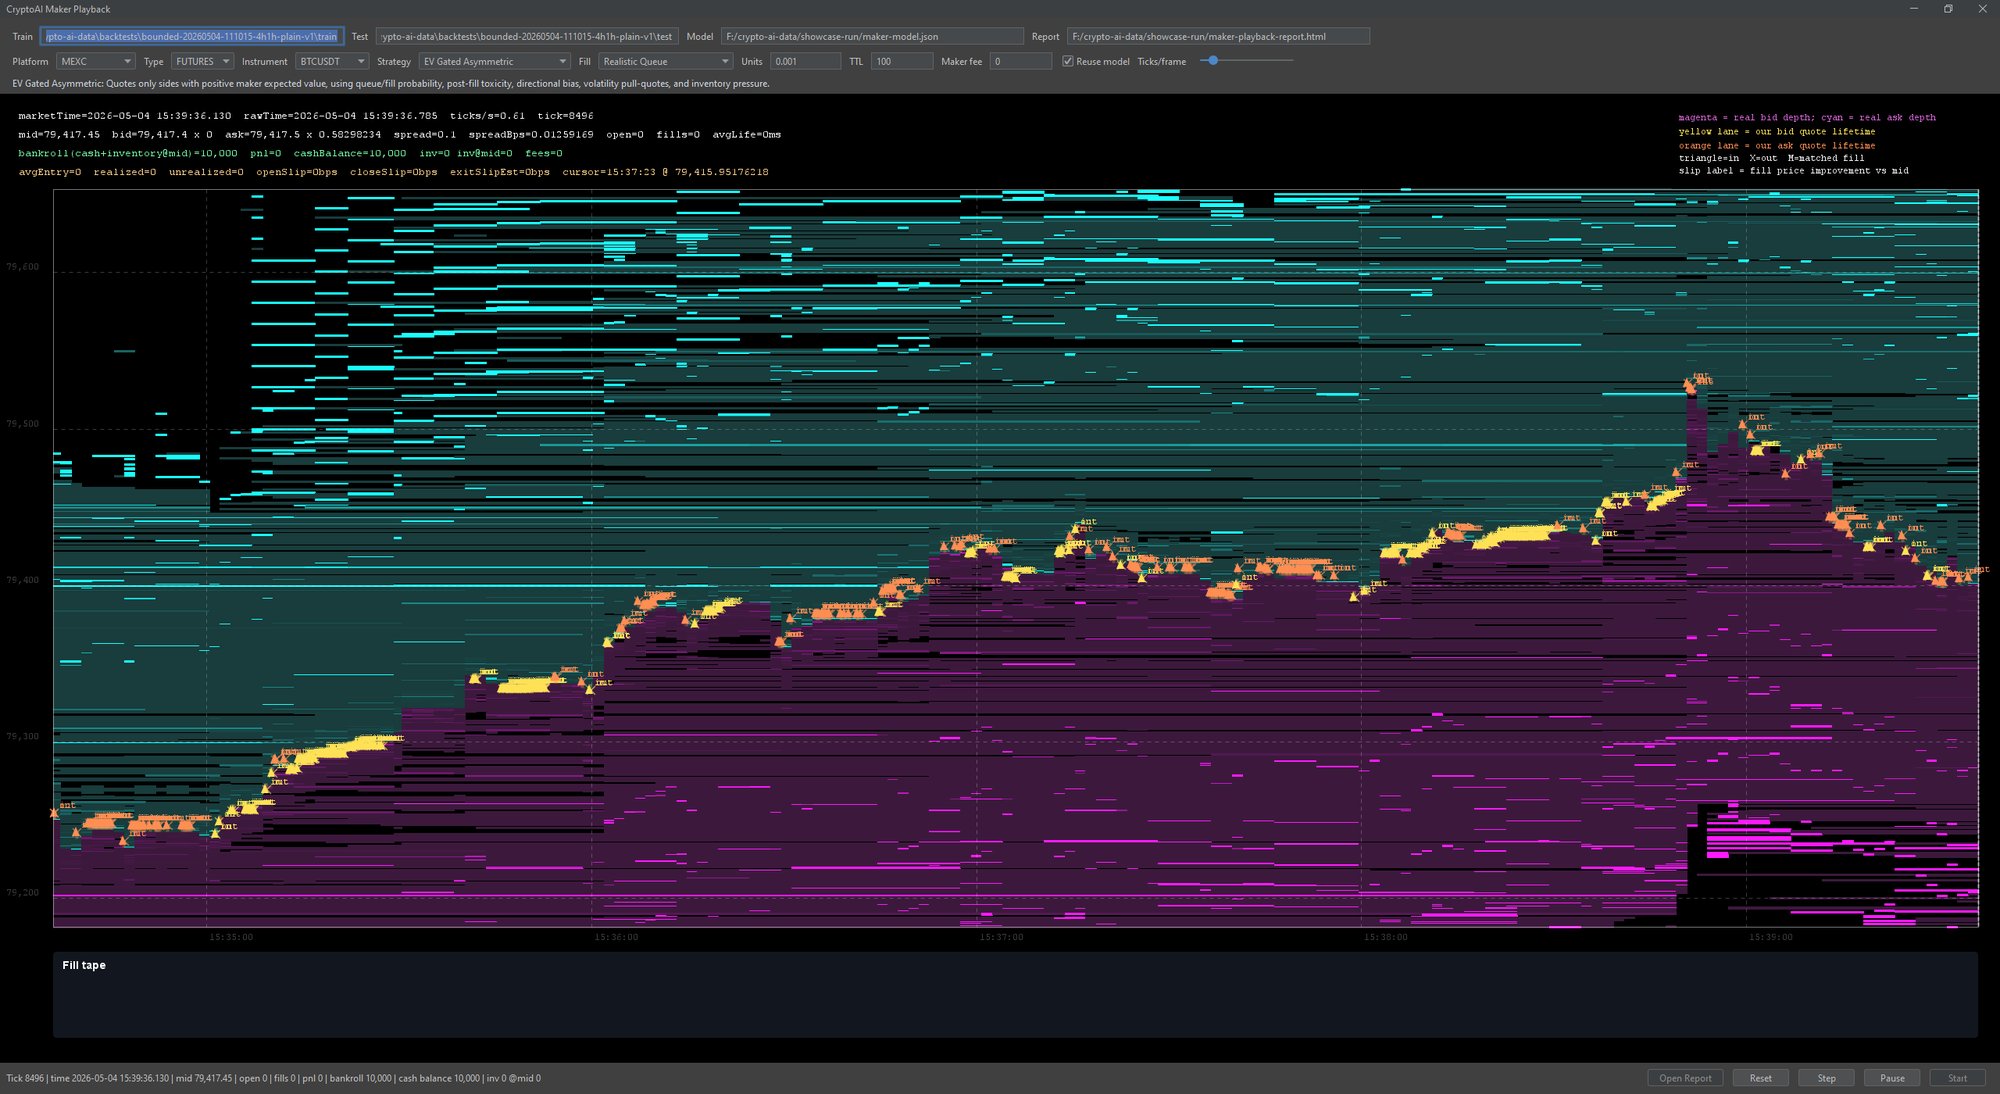
Replays recorded books and draws a market-making strategy's own quotes over the real depth: magenta is recorded bid depth, cyan recorded ask depth, and the yellow and orange lanes are the lifetimes of the strategy's bid and ask quotes. The fill tape underneath records each fill with its slippage against the midpoint. It trains its fill, toxicity, direction and volatility models on the first four hours and tests on the fifth, so the strategy never sees its test data.
Eleven strategies and nine fill models are selectable, from "fill whenever touched" to a realistic queue model that only fills when the recorded book proves the queue ahead has gone.
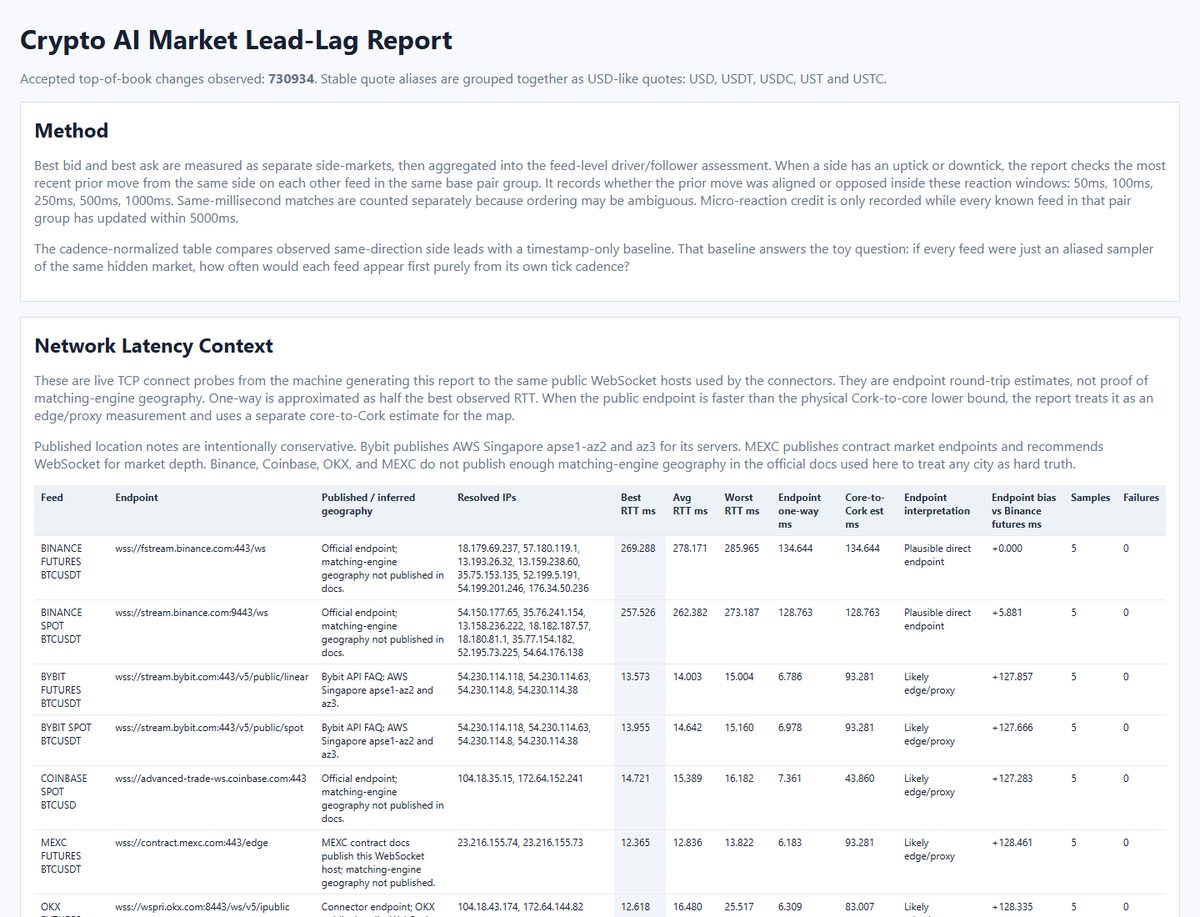
730,934 top-of-book changes across eight feeds, scored for which venue moves first and which follows, with TCP round-trip probes from Cork to every endpoint so network position isn't mistaken for price leadership. Bybit spot came out as the driver; MEXC futures as the clearest follower.
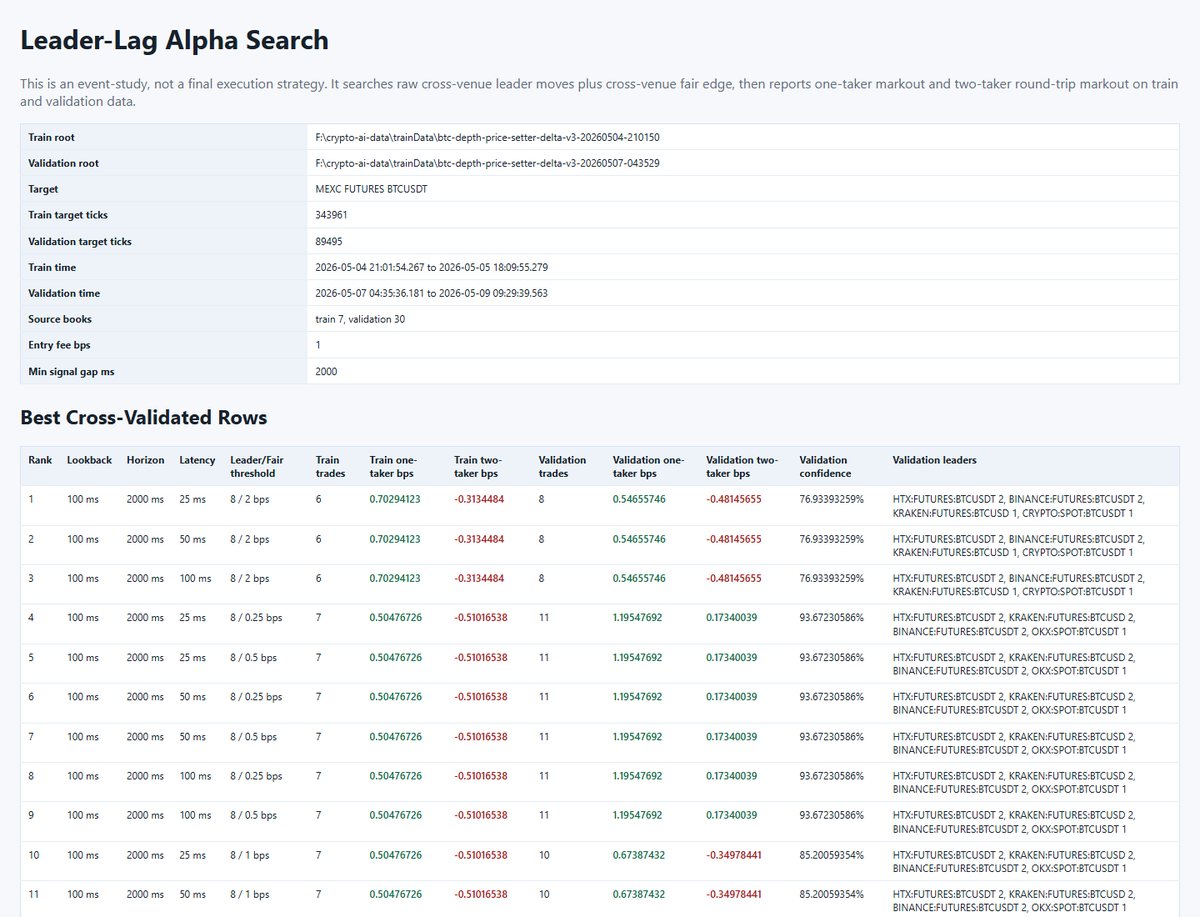
A grid over lookback, horizon, simulated latency and trigger thresholds, trained on one period and validated on a later, separate one. Each row shows one-taker and round-trip markout in basis points, with a confidence figure, so the cost of paying to exit is always in view.
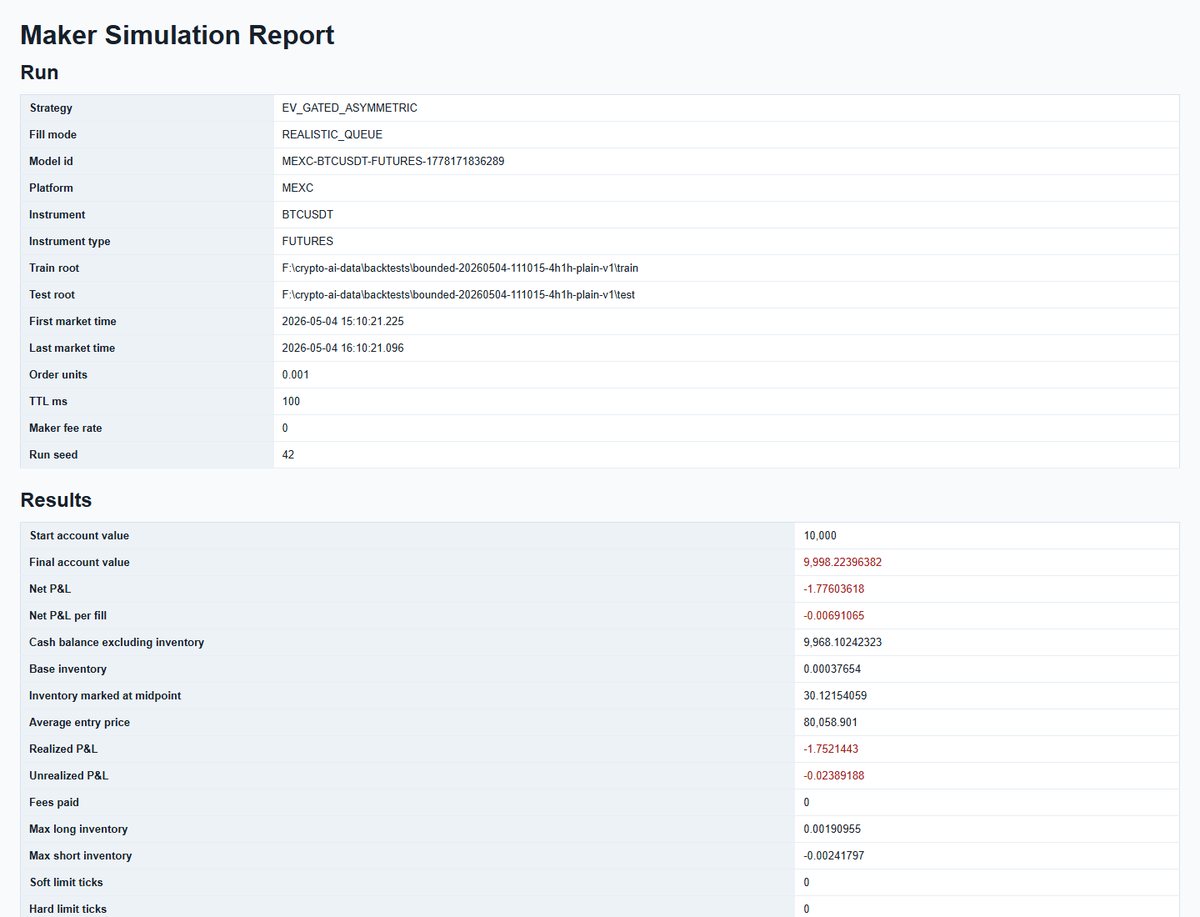
A full account of one run: 17,513 ticks, 1,774 orders, 257 fills, inventory limits and markouts. Under the realistic queue model this expected-value-gated strategy ended an hour down 1.78 on a 10,000 account. It is shown here because it lost; that is what the simulator was built to catch.
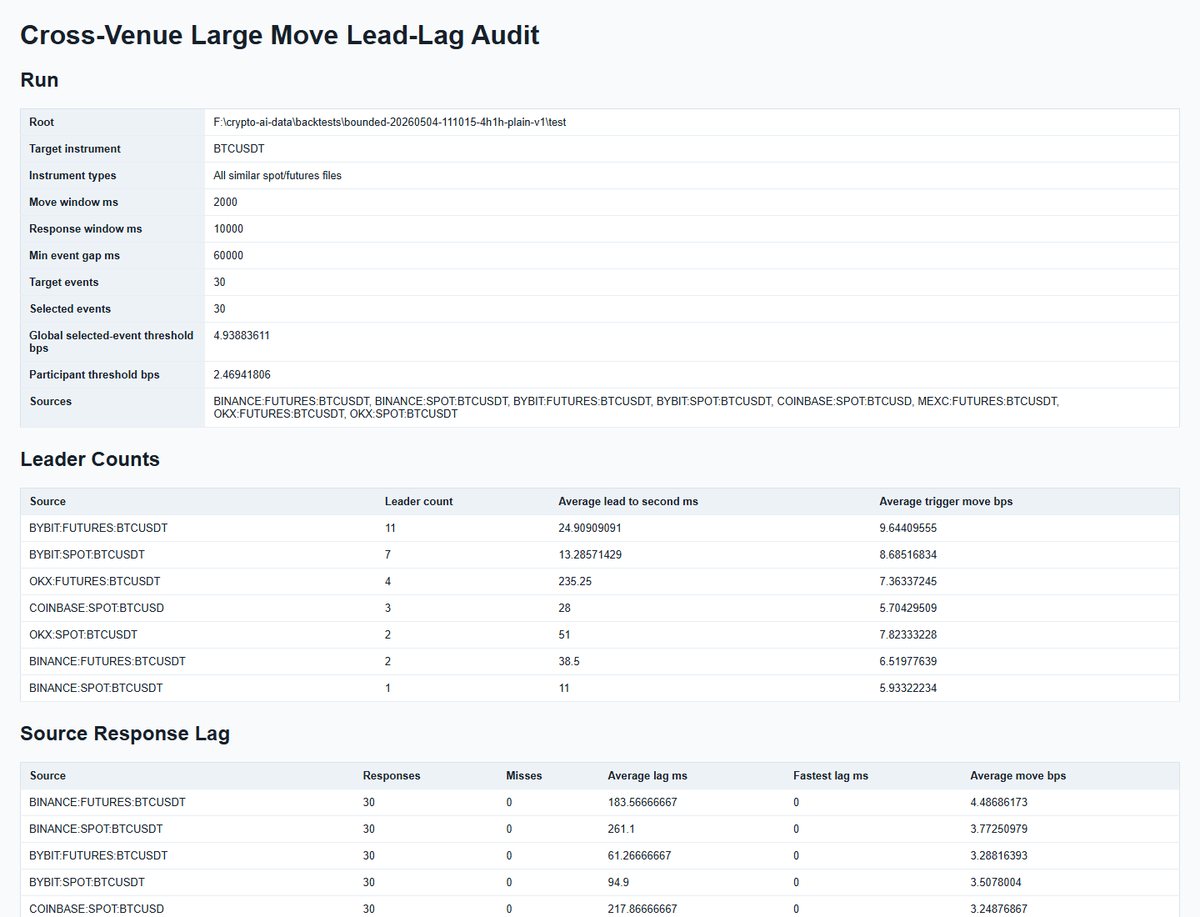
The thirty biggest BTC moves in a test hour, each traced across eight books. Bybit futures led most often; MEXC futures answered last, on average 411 ms behind. That gap is the opportunity the rest of the research tried to capture.
Streaming connectors for Binance, Coinbase and Dukascopy first, then the rest of the fourteen, all normalised into one order-book model, with the Swing viewer to watch them. Within the first fortnight came a situation model that turns the whole marketplace into a feature vector on every tick, and time- and tick-horizon predictors trained on recorded data with KD-tree lookups and Weka. 175 commits in the first month.
Epsilon-greedy, softmax and UCB agents, with and without eligibility traces, next to a rule-based baseline, each trading a simulated leveraged account from the predictor's signal, with replay-based reinforcement iterations over recorded data.
A month on the trading loop itself: opening and closing thresholds, exit handling and commission accounting. It was the first sign of what the 2026 research later measured precisely, that the exit is where most of the cost hides.
Rebuilt recording to capture up to 500 levels from eight venues in a compact binary snapshot-plus-delta format: the largest capture alone is 617 GB of books from under a week in May. On top of it, the lead-lag reports, a maker simulator with eleven strategies and nine fill models, taker lag-capture sweeps, capacity audits, and a MEXC futures account connector with signed REST, private WebSocket and IOC orders, guarded so nothing trades unless two separate switches are on.
The book service: rolling up-or-down markets aligned to Polymarket's windows, settled on Chainlink, priced on the live Chainlink stream and streamed to clients over WebSocket. Verified live against Polymarket's own candle opens.
Every connector tracks freshness. A socket that goes quiet is restarted, repeated failures escalate, and the recorder can replace its own process when a writer stalls, so a week-long capture survives exchange disconnects.
A binary snapshot-plus-delta format with a split tool that cuts recordings into train and test windows while keeping each book reconstructible, so simulators see exactly what the live system saw.
Nine fill models, from optimistic to REALISTIC_QUEUE, which only books a fill when the recorded book proves the queue ahead was consumed. Results are quoted under the harsh model.
Sweeps at 0, 25, 50, 75, 100 and 125 ms of simulated delay, plus TCP probes from Cork to each endpoint, so a strategy that only works at zero latency is caught early.
Depth-aware audits cap every simulated trade at a share of displayed top-of-book, turning "+613 bps" into the euros it could actually earn.
The MEXC futures path signs REST requests, listens on the private WebSocket and sends IOC orders, and it stays in shadow mode unless both the account switch and the strategy switch are on.